Connors RSI
Can Connors RSI catches market bottom?
December 4, 2022
Connors RSI (CRSI) is a momentum oscillator developed by Larry Connors and its team at Connors Research. It is acutally a composite indicator consist of 3 compoents:
ConnorsRSI(3,2,100) = [RSI(Close,3) + RSI(Streak,2) + PercentRank(100)] / 3
The first compoent is the classic Wilder’s RSI. It use 3 days average as default.
The second compoent is a also a RSI indicator but using the duration of up/down trend instead of close price. Default value is 2.
The final component of ConnorsRSI looks at the size of today’s price change in relation to previous price changes.
Amibroker AFL Code of ConnorsRSI:
//Connor's RSI (Larry Connors).  Code for function provided by Connors Research

paramLenRSI = Param("RSI Closes Length", 3, 2, 100, 1);
paramLenUD = Param("RSI UpClose Length", 2, 2, 100, 1);
paramLenRank = Param("PerecentRank Length", 100, 10, 200, 1);

function ConnorsRSI(lenRSI, lenUD, lenROC)
{
      upDays = BarsSince(C <= Ref(C,-1));
      downDays = BarsSince(C >= Ref(C,-1));
      updownDays = IIf(upDays > 0, upDays, IIf(downDays > 0, -downDays, 0));
      crsi = ( PercentRank(ROC(C,1), lenROC) + RSIa(updownDays,lenUD) +RSI(lenRSI))/3;
      return crsi;
}

Plot( ConnorsRSI(paramLenRSI,paramLenUD,paramLenRank)
      , "ConnorsRSI("+paramLenRSI+","+paramLenUD+","+paramLenRank+")"
      , colorBlue, styleLine, 0, 100);
ConnorsRSI Pullback Strategy Rules
Entry rules for the ConnorsRSI Pullback Strategy:
-
The stock price must be above $5 per share.
-
The stock’s average daily volume over the past 21 days (one trading month) must be at least 250,000 shares per day.
-
The stock’s 10‐day Average Directional Index (ADX) is above 30.
-
Today the stock’s lowest price is at least W% (W = 2, 4, 6, or 8) below the previous day’s close.
-
Today’s close is in the bottom X% (X = 10 or 25) of the day’s range.
-
The ConnorsRSI(3,2,100) value of the stock is below Y, where Y = 5, 6, 7… 15.
-
If the above rules are met today, buy the stock tomorrow on a further intraday limit Z% below today’s closing price (Z = 4, 6, 8, 10).
-
Exit the position when the stock closes with a ConnorsRSI(3,2,100) value above N (N = 50, 60 70 or 80), exiting at the closing price.
Some stocks are selected for back-testing from 1/1/2020 to 4/12/2022:
TSLA:
| Symbol | Trade | Date | Price | Ex. date | Ex. Price | % chg | Profit | % Profit | Shares | Position value | Cum. Profit | # bars | Profit/bar | MAE | MFE | Scale In/Out |
|---|---|---|---|---|---|---|---|---|---|---|---|---|---|---|---|---|
| TSLA | Long | 28/2/2020 | 41.98 | 14/4/2020 | 46.598 | 11.00% | 3291.25 | 10.98% | 714 | 29973.72 | 3291.25 | 32 | 102.85 | -44.34% | 28.15% | 0/0 |
| TSLA | Long | ½/2021 | 271.43 | 18/10/2021 | 283.93 | 4.61% | 1369.00 | 4.59% | 110 | 29857.30 | 4660.25 | 181 | 7.56 | -33.75% | 8.13% | 0/0 |
| TSLA | Long | 10/11/2021 | 336.8033 | 27/12/2021 | 357.89 | 6.26% | 1870.72 | 6.24% | 89 | 29975.50 | 6530.97 | 32 | 58.46 | -12.30% | 18.96% | 0/0 |
| TSLA | Open Long | 12/10/2022 | 215.33 | 2/12/2022 | 194.86 | -9.51% | -2851.33 | -9.53% | 139 | 29930.87 | 3679.64 | 38 | -75.03 | -22.82% | 10.25% | 0/0 |
VOO:
| Symbol | Trade | Date | Price | Ex. date | Ex. Price | % chg | Profit | % Profit | Shares | Position value | Cum. Profit | # bars | Profit/bar | MAE | MFE | Scale In/Out |
|---|---|---|---|---|---|---|---|---|---|---|---|---|---|---|---|---|
| VOO | Long | 28/2/2020 | 265.32 | 13/10/2020 | 323.64 | 21.98% | 6584.16 | 21.96% | 113 | 29981.16 | 6584.16 | 159 | 41.41 | -24.41% | 24.25% | 0/0 |
| VOO | Long | 8/3/2022 | 385.76 | 23/3/2022 | 412.16 | 6.84% | 2026.80 | 6.82% | 77 | 29703.52 | 8610.96 | 12 | 168.90 | -1.07% | 7.71% | 0/0 |
| VOO | Open Long | 26/9/2022 | 338.23 | 2/12/2022 | 374 | 10.58% | 3141.76 | 10.56% | 88 | 29764.24 | 11752.72 | 50 | 62.84 | -5.43% | 11.46% | 0/0 |
BABA:
| Symbol | Trade | Date | Price | Ex. date | Ex. Price | % chg | Profit | % Profit | Shares | Position value | Cum. Profit | # bars | Profit/bar | MAE | MFE | Scale In/Out |
|---|---|---|---|---|---|---|---|---|---|---|---|---|---|---|---|---|
| BABA | Long | 28/1/2020 | 209.74 | 17/4/2020 | 214.98 | 2.50% | 743.32 | 2.48% | 143 | 29992.82 | 743.32 | 57 | 13.04 | -18.97% | 8.09% | 0/0 |
| BABA | Long | 9/9/2020 | 274.45 | 1/10/2020 | 295.26 | 7.58% | 2262.29 | 7.56% | 109 | 29915.05 | 3005.61 | 17 | 133.08 | -3.60% | 7.58% | 0/0 |
| BABA | Long | 23/8/2021 | 159.28 | 8/10/2021 | 159.86 | 0.36% | 103.04 | 0.34% | 188 | 29944.64 | 3108.65 | 34 | 3.03 | -13.09% | 11.87% | 0/0 |
| BABA | Long | 2/12/2021 | 123.02 | ⅖/2022 | 96.41 | -21.63% | -6472.23 | -21.65% | 243 | 29893.86 | -3363.58 | 104 | -62.23 | -40.43% | 12.75% | 0/0 |
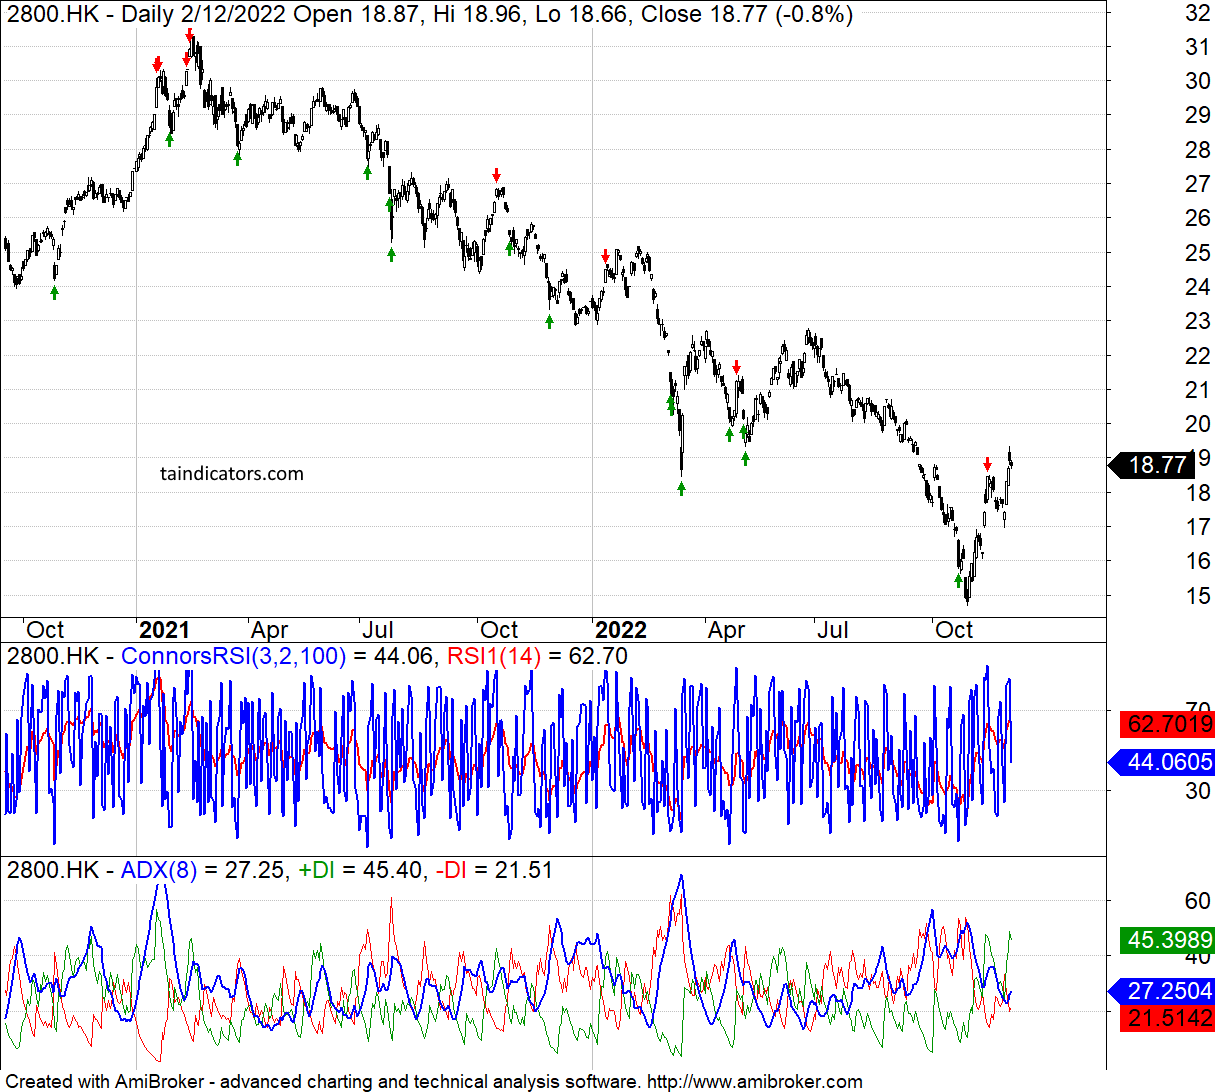
Can it work with HK Market?
0005.HK:
| Symbol | Trade | Date | Price | Ex. date | Ex. Price | % chg | Profit | % Profit | Shares | Position value | Cum. Profit | # bars | Profit/bar | MAE | MFE | Scale In/Out |
|---|---|---|---|---|---|---|---|---|---|---|---|---|---|---|---|---|
| 0005.HK | Long | 28/2/2020 | 53.35 | 8/6/2020 | 41.1 | -22.96% | -6890.50 | -22.98% | 562 | 29982.70 | -6890.50 | 68 | -101.33 | -34.40% | 0.09% | 0/0 |
| 0005.HK | Long | 3/3/2022 | 52.6 | 19/10/2022 | 41.7 | -20.72% | -6219.00 | -20.74% | 570 | 29982.00 | -13109.50 | 156 | -39.87 | -26.81% | 4.75% | 0/0 |
0941.HK:
| Symbol | Trade | Date | Price | Ex. date | Ex. Price | % chg | Profit | % Profit | Shares | Position value | Cum. Profit | # bars | Profit/bar | MAE | MFE | Scale In/Out |
|---|---|---|---|---|---|---|---|---|---|---|---|---|---|---|---|---|
| 0941.HK | Long | 13/3/2020 | 50.9 | 8/4/2020 | 63.5 | 24.75% | 7415.40 | 24.73% | 589 | 29980.10 | 7415.40 | 19 | 390.28 | -11.20% | 24.75% | 0/0 |
| 0941.HK | Long | 1/9/2020 | 54 | 18/2/2021 | 49.8 | -7.78% | -2337.00 | -7.80% | 555 | 29970.00 | 5078.40 | 115 | -20.32 | -27.78% | 1.76% | 0/0 |
| 0941.HK | Long | 15/3/2021 | 52.6 | 23/4/2021 | 52.75 | 0.29% | 79.50 | 0.27% | 570 | 29982.00 | 5157.90 | 27 | 2.94 | -5.89% | 3.99% | 0/0 |
| 0941.HK | Long | ⅓/2022 | 52.55 | 23/3/2022 | 54.1 | 2.95% | 877.50 | 2.93% | 570 | 29953.50 | 6035.40 | 17 | 51.62 | -9.04% | 3.62% | 0/0 |
| Symbol | Trade | Date | Price | Ex. date | Ex. Price | % chg | Profit | % Profit | Shares | Position value | Cum. Profit | # bars | Profit/bar | MAE | MFE | Scale In/Out |
|---|---|---|---|---|---|---|---|---|---|---|---|---|---|---|---|---|
| 2800.HK | Long | 22/1/2020 | 28.3 | 7/2/2020 | 27.5 | -2.83% | -854.00 | -2.85% | 1060 | 29998.00 | -854.00 | 11 | -77.64 | -7.07% | 1.06% | 0/0 |
| 2800.HK | Long | 18/3/2020 | 23.6 | 8/6/2020 | 25.34 | 7.37% | 2205.54 | 7.35% | 1271 | 29995.60 | 1351.54 | 55 | 40.10 | -9.53% | 7.37% | 0/0 |
| 2800.HK | Long | 29/1/2021 | 28.9 | 11/2/2021 | 30.32 | 4.91% | 1467.96 | 4.89% | 1038 | 29998.20 | 2819.50 | 10 | 146.80 | -1.66% | 4.91% | 0/0 |
| 2800.HK | Long | 28/7/2021 | 26 | 21/10/2021 | 26.8 | 3.08% | 916.40 | 3.06% | 1153 | 29978.00 | 3735.90 | 58 | 15.80 | -6.31% | 5.15% | 0/0 |
| 2800.HK | Long | 1/12/2021 | 23.72 | 13/1/2022 | 24.64 | 3.88% | 1156.88 | 3.86% | 1264 | 29982.08 | 4892.78 | 31 | 37.32 | -3.79% | 3.88% | 0/0 |
| 2800.HK | Long | 8/3/2022 | 21.28 | ⅗/2022 | 21.04 | -1.13% | -344.16 | -1.15% | 1409 | 29983.52 | 4548.62 | 37 | -9.30 | -13.35% | 6.86% | 0/0 |
| 2800.HK | Long | 25/10/2022 | 15.9 | 16/11/2022 | 18.26 | 14.84% | 4444.96 | 14.82% | 1886 | 29987.40 | 8993.58 | 17 | 261.47 | -7.67% | 16.10% | 0/0 |
Buy-and-hold strategy in recent two years is not a good idea in bear market. It seems that Connors RSI Pullback Strategy provides an approach to catch the chance. But who can really sure whether it catches the bottom reversal moment or a falling knife?